LeakCanary原理解析

内存泄漏

LeakCanary

观察具体的指定对象

创建一个RefWatcher,然后给予它一个需要观察的对象:

1
2
3
4
5
6
7
8
9
10
11
12
13
class Cat {
}
class Box {
Cat hiddenCat;
}
class Docker {
static Box container;
}
// ...
Box box = new Box();
Cat schrodingerCat = new Cat();
box.hiddenCat = schrodingerCat;
Docker.container = box;
1
2
// We expect schrodingerCat to be gone soon (or not), let's watch it.
refWatcher.watch(schrodingerCat);

内存泄漏发生时:

1
2
3
* GC ROOT static Docker.container
* references Box.hiddenCat
* leaks Cat instance

安装LeakCanary:

1
2
3
4
5
6
public class ExampleApplication extends Application {
@Override public void onCreate() {
super.onCreate();
LeakCanary.install(this);
}
}
介绍
LeakCanary如何工作
  • 检测遗留的实例

LeakCanary是基于一个叫做ObjectWatcher Android的库。它通过侵入Android生命周期来自动在正确的时机(activity和fragment被销毁并且应该被回收的时候)去检测。这些被销毁的实例被传递给一个ObjectWatcher,它持有着它们(Activity和Fragmet)的引用。

如果弱引用在等待5s并且运行垃圾回收器之后还未被清除,被观察的实例就被认为是遗留下来的,并且可能导致潜在的泄漏。

  • Dump堆

当遗留的实例达到一个阈值,LeakCanary dump Java堆到一个.hprof文件。默认的阈值是当app可见的时候是5个保留的实例,不可见的时候是1个保留的实例。

  • 分析堆

LeakCanary使用Shark解析.hprof文件,然后查找出阻止遗留对象被垃圾回收所回收的引用链:leak trace。Leak trace的另一个名称是最短的从垃圾回收roots到保留对象的强引用路径。一旦leak trace确定下来后,LeakCanary使用Android framework本身的原理去演绎leak trace上的哪个实例是泄漏的。

  • Grouping leak

根据泄漏的状态信息,LeakCanary缩小引用链到一个可能的泄漏原因的子引用链,并且展示结果。相同泄漏原因的引用链被当成是同一种泄漏,所以根据同样的子链来进行泄漏原因的分组。

如何解决一个内存泄漏?
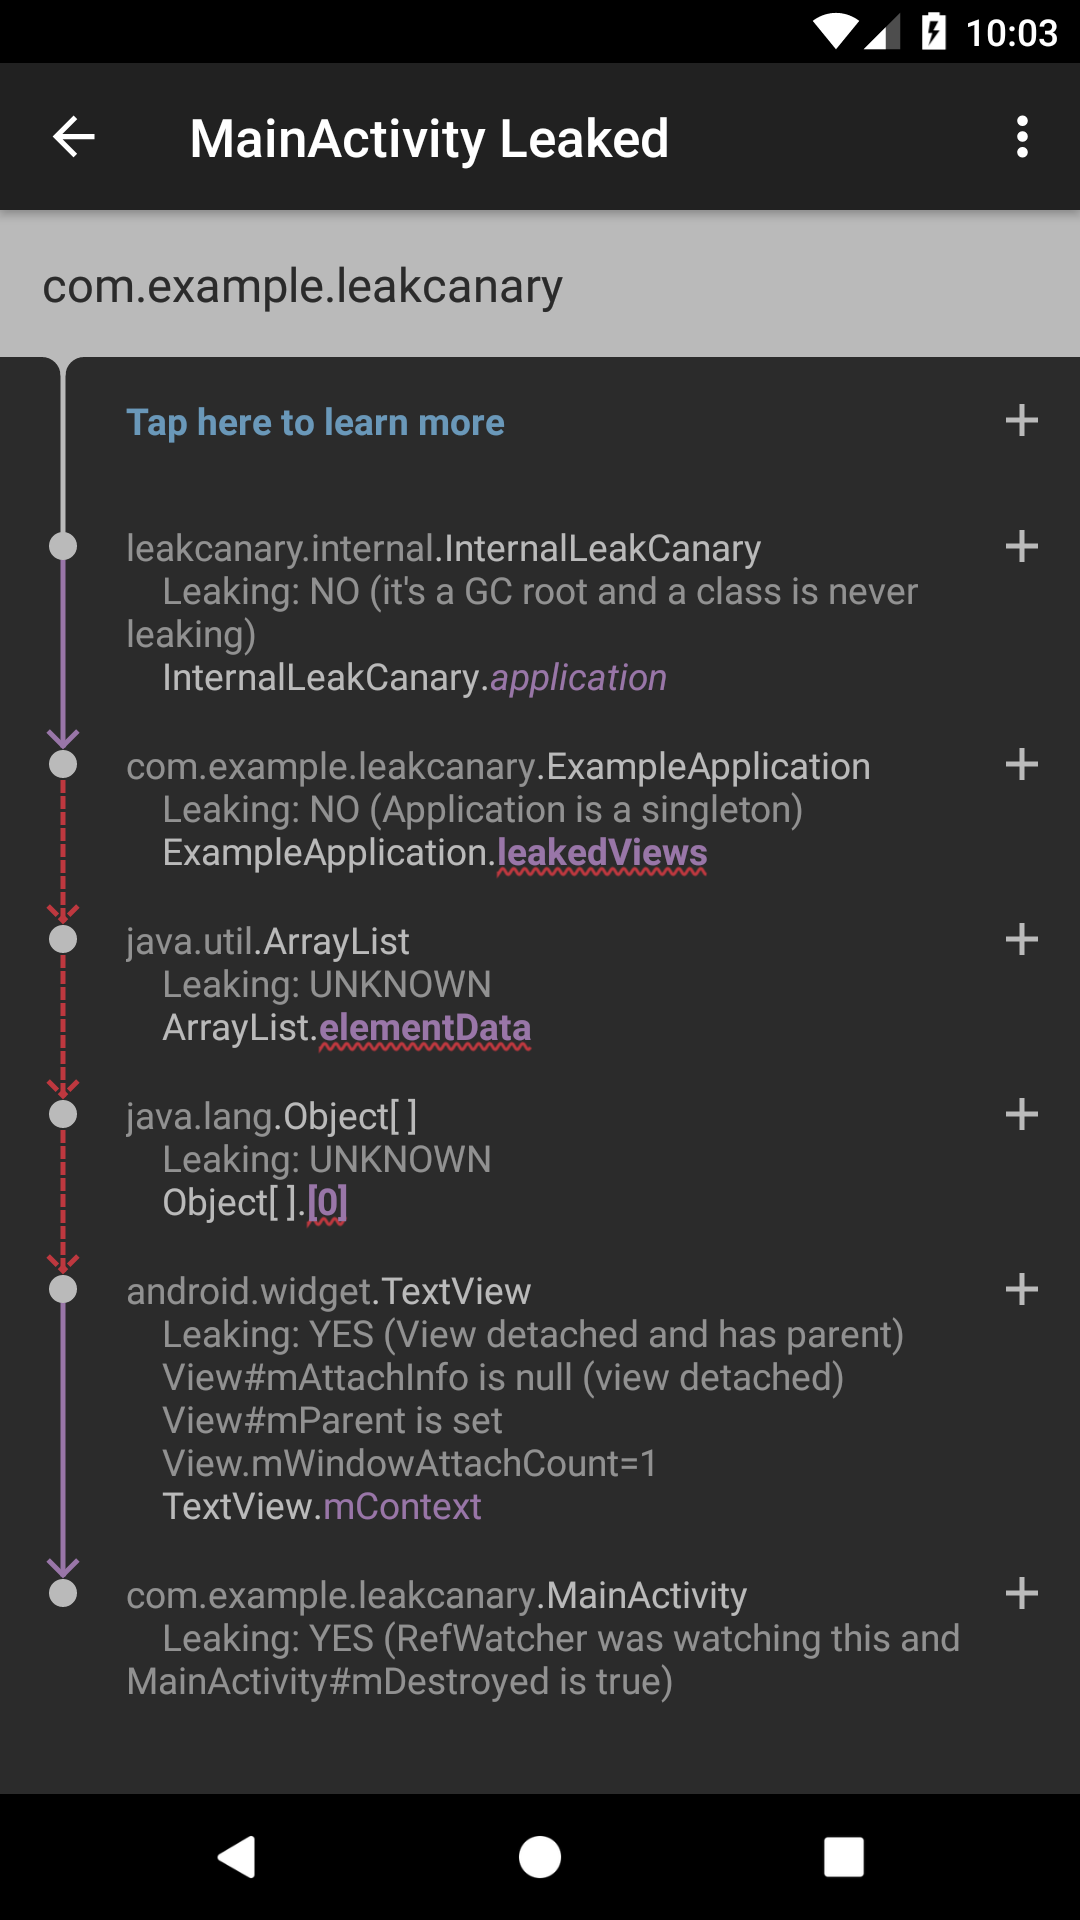
  • 观察内存泄漏时的ui报告和logCat输出

leak trace

1
2
3
4
5
6
7
8
9
10
11
12
13
14
15
16
17
18
19
20
21
22
23
24
25

├─ leakcanary.internal.InternalLeakCanary
│ Leaking: NO (it's a GC root and a class is never leaking)
│ ↓ static InternalLeakCanary.application
├─ com.example.leakcanary.ExampleApplication
│ Leaking: NO (Application is a singleton)
│ ↓ ExampleApplication.leakedViews
│ ~~~~~~~~~~~
├─ java.util.ArrayList
│ Leaking: UNKNOWN
│ ↓ ArrayList.elementData
│ ~~~~~~~~~~~
├─ java.lang.Object[]
│ Leaking: UNKNOWN
│ ↓ array Object[].[0]
│ ~~~
├─ android.widget.TextView
│ Leaking: YES (View detached and has parent)
│ View#mAttachInfo is null (view detached)
│ View#mParent is set
│ View.mWindowAttachCount=1
│ ↓ TextView.mContext
╰→ com.example.leakcanary.MainActivity
Leaking: YES (RefWatcher was watching this and MainActivity#mDestroyed
is true)
  • 对象和引用
1
├─ android.widget.TextView

leak trace中的每个节点要么是一个Java对象,一个类,一个对象数组或者一个实例

1
│    ↓ TextView.mContext

每个节点都有一个引用指向下一个节点。在UI中,引用是用紫色标识的。在Logcat输出中,这个引用是用一个向下的箭头开始的。

  • GC Root
1
2
3

├─ leakcanary.internal.InternalLeakCanary
│ Leaking: NO (it's a GC root and a class is never leaking)

leak trace的顶部是一个gc root。GC roots是特殊的对象,它们总是可达的。有四种GC roots值得注意:

  1. 属于一个线程局部变量
  2. 活动Java线程的实例
  3. 类,在Android中不会卸载
  4. 原生引用,由原生代码控制
  • 泄漏的实例
1
2
3
╰→ com.example.leakcanary.MainActivity
Leaking: YES (RefWatcher was watching this and MainActivity#mDestroyed
is true)

在leak trace的底部是泄漏的实例。这个实例被传递给AppWatcher.objectWatcher来确定它会被垃圾回收,并且最终不被垃圾回收,则会触发LeakCanary.

  • 引用链
1
2
3
4
5
6
7
8
9
10
11
...
│ ↓ static InternalLeakCanary.application
...
│ ↓ ExampleApplication.leakedViews
...
│ ↓ ArrayList.elementData
...
│ ↓ array Object[].[0]
...
│ ↓ TextView.mContext
...

从GC root到泄漏实例的引用链是会阻止泄漏实例被垃圾回收的链。如果能够及时识别出在那个点不该存在的引用,那么就可以推断出为什么它仍然错误的被设置,然后修复内存泄漏。

  • 提示和标签
1
2
3
4
5
├─ android.widget.TextView
│ Leaking: YES (View detached and has parent)
│ View#mAttachInfo is null (view detached)
│ View#mParent is set
│ View.mWindowAttachCount=1

LeakCanary运行试探法来决定leak trace上的节点的生命周期状态,从而决定它们是否泄漏。比如,如果一个view有:View#mAttachInfo = nullmParent != null,则它已经是detached并且有一个parent,所以这个view可能就存在泄漏。在leak trace上,遍历每个节点会有Leaking: YES / NO / UNKNOWN和括号中的解释。LeakCanary可以提取额外的关于节点状态的信息,比如:View.mWindowAttachCount=1,LeanCanary来自于一组默认的提示:AndroidObjectInspectors。可以通过更新LeakCanary.Config.objectInspectors 来更新自己的提示推断。

  • 缩小导致泄漏的原因
1
2
3
4
5
6
7
8
9
10
11
12
13
14
15
16
17
18
19
20
21
22
23

├─ android.provider.FontsContract
│ Leaking: NO (ExampleApplication↓ is not leaking and a class is never leaking)
│ GC Root: System class
│ ↓ static FontsContract.sContext
├─ com.example.leakcanary.ExampleApplication
│ Leaking: NO (Application is a singleton)
│ ExampleApplication does not wrap an activity context
│ ↓ ExampleApplication.leakedViews
│ ~~~~~~~~~~~
├─ java.util.ArrayList
│ Leaking: UNKNOWN
│ ↓ ArrayList.elementData
│ ~~~~~~~~~~~
├─ java.lang.Object[]
│ Leaking: UNKNOWN
│ ↓ array Object[].[1]
│ ~~~
├─ android.widget.TextView
│ Leaking: YES (View.mContext references a destroyed activity)
│ ↓ TextView.mContext
╰→ com.example.leakcanary.MainActivity
Leaking: YES (TextView↑ is leaking and Activity#mDestroyed is true and ObjectWatcher was watching this)

如果一个节点没有泄漏,那么之前的任何指向它的引用都不是泄漏的来源,同时不会泄漏。类似地,如果一个节点泄漏了,那么leak trace上这个节点之下的所有节点也存在泄漏。基于此,我们可以推断出泄漏是在最后一个Leaking: NO和第一个Leaking: YES之间。

LeakCanary在UI中用一个红色的下划线来高亮显示,或者在Logcat输出中用三个~下划线显示。这些高亮的引用是泄漏的唯一可能的原因。应该深入调查这些引用。

在这个例子中,最后一个Leaking: NO是在com.example.leakcanary.ExampleApplication并且第一个Leaking: YES是在android.widget.TextView,所以泄漏发生在下面3个引用之一:

1
2
3
4
5
6
7
8
9
10
...
│ ↓ ExampleApplication.leakedViews
│ ~~~~~~~~~~~
...
│ ↓ ArrayList.elementData
│ ~~~~~~~~~~~
...
│ ↓ array Object[].[0]
│ ~~~
...

跟踪源码,发现ExampleApplication有一个list 字段:

1
2
3
open class ExampleApplication : Application() {
val leakedViews = mutableListOf<View>()
}

ArrayList的实现本身不太可能有bug,所以泄漏发生的原因是我们添加views到ExampleApplication.leakedViews。如果不这样做,就能解决这个泄漏。

Shark使用

下载

这里下载sharkCli到本地:D:\shark-cli-2.0-beta-1,然后用git bash打开一个已有的hprof文件:

1569572394721

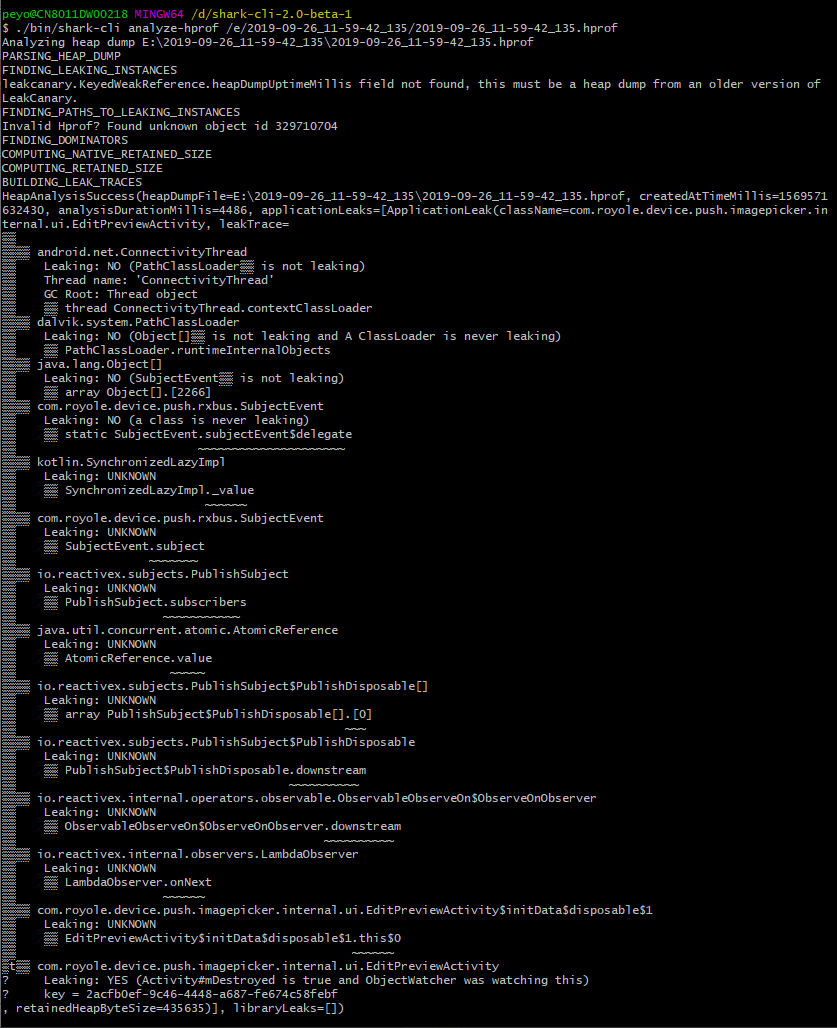
可以看到它其实跟用leakcanary安装在app上边dump出来的效果一样,只是这样方便在电脑上看。(当然logcat中也有打印就是啦…)

源码解析

根据LeakCanary的源码组成模块原理解析:

Shark

堆分析器

ObjectWatcher

观察保留的对象并且检测他们是否变得弱可达

组件id:com.squareup.leakcanary:leakcanary-object-watcher

原理解析

GcTrigger:利用AOSP中的代码触发垃圾回收,并且将KeyedWeakReference与其关联的ReferenceQueue引用队列进行入列。

垃圾回收:采用Runtime.gc()System.gc()不会每次都垃圾收集。

引用队列入列:在Finalization前线程睡眠100ms,给予足够的时间进行入列。

联想一下,我们如果操作判断activity是否泄漏:进入退出一个activity,触发gc,dump hprof,用mat判断里边是否仍然有该activity对象。

KeyedWeakReference:继承于WeakReference的弱引用对象。用来判断哪些对象是否是弱可达。ObjectWatcher会持有这个对象的实例,通过LinkedHashMapkey和该对象进行映射保存起来。然后通过key来判断哪些KeyedWeakReference实例还未入列到关联的ReferenceQueue引用队列。构造函数参数传入被观察的对象以及引用队列,构造方法会调用父类也就是WeakReference的构造方法。

而传入被观察的对象以及引用队列跟内存泄漏有什么关系呢?

WeakReference:我们知道对象根据引用类型氛围强引用,软引用,弱引用。每次进行垃圾回收的时候会自动清除所有的弱引用对象和该弱可达对象通过一个强引用和软引用链引用到的其他弱引用。同时,它会将之前的弱可达对象声明为finalizable。与此同时,可能在之后的某个时刻它会将刚清除的弱引用以及与其注册的引用队列入列。

所以前面在KeyedWeakReference构造函数中传入的被观察对象和引用队列就是用来进行注册关联的。

小结:我们所观察的对象在被垃圾回收后可以在引用队列中找到,所以如果引用队列中如果没有该对象,说明它被回收了。如果它还在,那么说明此时它仍然在被持有。

ObjectWatcher:在使用一节中,可以看到我们用ObjectWatcher来观察对象。它会创建KeyedWeakReference实例来引用观察对象,并且通过checkRetainedExecutor来检测这些对象是否已经被清除了。如果没有,这些对象会被当成遗留下来的,然后ObjectWatcher会在执行线程调用onObjectRetainedListener回调通知。ObjectWatcher是线程安全的。

checkRetainedExecutor:在后台线程中执行任务,重要的是给GC识别弱可达对象。

onObjectRetainedListeners:识别到遗留对象时的回调接口。

实际上,ObjectWatcher的内部编码就是实现了我们在小结中所说的事。

1
2
3
4
5
6
7
8
9
10
11
12
13
14
15
16
17
18
19
20
21
22
23
24
25
26
27
28
29
30
31
32
33
34
35
36
37
38
39
40
41
42
43
44
45
46
47
48
49
50
51
52
53
54
55
56
57
58
//watchedObjects用来保存需要观察的对象
private val watchedObjects = mutableMapOf<String, KeyedWeakReference>()
//引用队列
private val queue = ReferenceQueue<Any>()
//Synchronized用来保证线程安全,watch观察对象的方法
@Synchronized fun watch(watchedObject: Any) {
watch(watchedObject, "")
}@Synchronized fun watch(
watchedObject: Any,
name: String
) {
if (!isEnabled()) {
return
}
//先移除掉弱可达的对象
removeWeaklyReachableObjects()
val key = UUID.randomUUID()
.toString()
val watchUptimeMillis = clock.uptimeMillis()
//生成KeyedWeakReference对象,将被观察对象与引用队列关联
val reference =
KeyedWeakReference(watchedObject, key, name, watchUptimeMillis, queue)
SharkLog.d {
"Watching " +
(if (watchedObject is Class<*>) watchedObject.toString() else "instance of ${watchedObject.javaClass.name}") +
(if (name.isNotEmpty()) " named $name" else "") +
" with key $key"
}
//保存在待观察列表中
watchedObjects[key] = reference
//在后台线程执行分析判断(默认在object-watcher-android InternalAppWatcher#checkRetainedExecutor传入,5s后执行这个线程,即默认这个对象存在5s还存在,则判定泄漏)
checkRetainedExecutor.execute {
moveToRetained(key)
}
}

@Synchronized private fun moveToRetained(key: String) {
//step1.检测前再次清空
removeWeaklyReachableObjects()
//step2.在step1中已经将弱引用的对象移除掉了,此时如果通过key还能在我们的本地变量中找到,说明它仍然被持有
val retainedRef = watchedObjects[key]
if (retainedRef != null) {
retainedRef.retainedUptimeMillis = clock.uptimeMillis()
onObjectRetainedListeners.forEach { it.onObjectRetained() }
}
}

private fun removeWeaklyReachableObjects() {
//弱引用指向的对象在变得弱可达的时候会入列。这个动作在垃圾回收真正开始前(常见的误解是在垃圾回收之后发生这个动作)
var ref: KeyedWeakReference?
do {
ref = queue.poll() as KeyedWeakReference?
if (ref != null) {
//如果引用队列中没有这个对象,则没有内存泄漏,将它从被观察对象中移除。
watchedObjects.remove(ref.key)
}
} while (ref != null)
}

ObjectWatcher Android

自动检测遗留的已经销毁的activity和fragment,跟上面库的区别在于它是用来检测Android中独有的activity,fragment这些组件

组件id:com.squareup.leakcanary:leakcanary-object-watcher-android

原理解析

AppWatcherandroid应用中使用ObjectWatcher的入口API,前面说到AppWatcher.objectWatcher负责检测保留的对象,AppWatcher在app启动的时候自动配置来传入activity和fragment实例。调用ObjectWatcher.watch来观察任何可能期望到的不可达的对象

首先,我们会发现在安装我们app的时候,会自动安装leakcanary应用

这个现象是如何实现的呢?它的实现就是在ObjectWatcher Android之中,首先在Androidmanifest.xml中会发现注册了一个content provider

1
2
3
4
<provider
android:name="leakcanary.internal.AppWatcherInstaller$MainProcess"
android:authorities="${applicationId}.leakcanary-installer"
android:exported="false"/>

Content providers会在application类创建之前加载,这里注册的AppWatcherInstaller作用是在application启动的时候安装leakcanary.AppWatcher.注意到默认是在MainProcess中进行安装,当指定leakcanary-android-process组件的时候,会在LeakCanaryProcess进程中进行安装。在主进程安装的时候调用InternalAppWatcher进行安装:

1
2
3
4
5
6
7
8
9
10
11
12
13
14
15
16
17
18
19
20
21
22
23
24
25
26
27
28
29
30
31
32
33
34
35
36
37
38
39
40
41
42
43
44
45
46
47
48
49
50
51
52
53
54
55
56
57
58
59
60
61
62
63
64
65
66
67
68
69
70
71
init {
//初始化的时候通过反射拿到InternalLeakCanary对象实例
val internalLeakCanary = try {
val leakCanaryListener = Class.forName("leakcanary.internal.InternalLeakCanary")
leakCanaryListener.getDeclaredField("INSTANCE")
.get(null)
} catch (ignored: Throwable) {
NoLeakCanary
}
@kotlin.Suppress("UNCHECKED_CAST")
onAppWatcherInstalled = internalLeakCanary as (Application) -> Unit
}

fun install(application: Application) {
SharkLog.logger = DefaultCanaryLog()
SharkLog.d { "Installing AppWatcher" }
//检查主线程
checkMainThread()
//如果已经初始化过了,则直接返回
if (this::application.isInitialized) {
return
}
InternalAppWatcher.application = application

val configProvider = { AppWatcher.config }
//注册Activity和fragment销毁的监听
ActivityDestroyWatcher.install(application, objectWatcher, configProvider)
FragmentDestroyWatcher.install(application, objectWatcher, configProvider)
onAppWatcherInstalled(application)
}


internal class ActivityDestroyWatcher private constructor(
private val objectWatcher: ObjectWatcher,
private val configProvider: () -> Config
) {

//返回一个sam,委托noOpDelegate通过动态代理拿到Application.ActivityLifecycleCallbacks对象,拿到其中的sam:onActivityDestroyed,拿到其中的activity。
private val lifecycleCallbacks =
object : Application.ActivityLifecycleCallbacks by noOpDelegate() {
override fun onActivityDestroyed(activity: Activity) {
if (configProvider().watchActivities) {
//通过构造函数传入的objectWatcher监听,这样在application中,所有的Activity销毁都能被监听到
objectWatcher.watch(activity)
}
}
}

companion object {
fun install(
application: Application,
objectWatcher: ObjectWatcher,
configProvider: () -> Config
) {
val activityDestroyWatcher =
ActivityDestroyWatcher(objectWatcher, configProvider)
//注册application中Activity的回调 application.registerActivityLifecycleCallbacks(activityDestroyWatcher.lifecycleCallbacks)
}
}
}
Fragment的生命周期监听类似,不过Fragment考虑的情况多一些,除了onFragmentDestroyed回调,还有onFragmentViewDestroyed回调,同时还要监听Activity:
application.registerActivityLifecycleCallbacks(object : Application.ActivityLifecycleCallbacks by noOpDelegate() {
override fun onActivityCreated(
activity: Activity,
savedInstanceState: Bundle?
) {
for (watcher in fragmentDestroyWatchers) {
watcher(activity)
}
}
})

前面完成了监听Activity和fragment,接着调用onAppWatcherInstalled(application)

这个函数的调用是在哪呢?它的作用是什么?

onAppWatcherInstalled用到了invoke约定,所以我们看InternalLeakCanaryinvoke函数:

1
2
3
4
5
6
7
8
9
10
11
12
13
14
15
16
17
18
19
20
21
22
23
24
25
26
27
28
29
30
override fun invoke(application: Application) {
this.application = application
//注册检测到对象遗留的回调监听
AppWatcher.objectWatcher.addOnObjectRetainedListener(this)
//初始化数据:
val heapDumper = AndroidHeapDumper(application, leakDirectoryProvider)

val gcTrigger = GcTrigger.Default

val configProvider = { LeakCanary.config }

val handlerThread = HandlerThread(LEAK_CANARY_THREAD_NAME)
handlerThread.start()
val backgroundHandler = Handler(handlerThread.looper)

heapDumpTrigger = HeapDumpTrigger(
application, backgroundHandler, AppWatcher.objectWatcher, gcTrigger, heapDumper,
configProvider
)
//结束初始化
//可见性监听器(不同可见性下,内存泄漏条件中泄漏对象判定不同)
application.registerVisibilityListener { applicationVisible ->
this.applicationVisible = applicationVisible
heapDumpTrigger.onApplicationVisibilityChanged(applicationVisible)
}
//判断是否已经有桌面快捷图标,如果没有,则在launcher生成图标快捷键
addDynamicShortcut(application)

disableDumpHeapInInstrumentationTests()
}

前面我们讲过了在ObjectWatcher中发生对象泄漏时会有回调,这里我们也监听了,那么发生监听时,会发生什么:

1
2
3
4
5
6
7
8
9
10
11
12
13
14
15
16
17
18
19
20
21
22
23
24
25
26
27
28
29
30
31
32
33
34
35
36
37
38
39
40
41
42
43
44
45
46
47
48
49
50
51
52
53
54
55
56
57
58
59
60
61
62
63
64
override fun onObjectRetained() {
if (this::heapDumpTrigger.isInitialized) {
heapDumpTrigger.onObjectRetained()
}
}

====HeapDumpTrigger#onObjectRetained()====
fun onObjectRetained() {
scheduleRetainedObjectCheck("found new object retained")
}

private fun scheduleRetainedObjectCheck(reason: String) {
if (checkScheduled) {
SharkLog.d { "Already scheduled retained check, ignoring ($reason)" }
return
}
checkScheduled = true
//前面我们传入的HandlerThread中的handler,名为LEAK_CANARY_THREAD_NAME
backgroundHandler.post {
checkScheduled = false
//真正的检测遗留的对象
checkRetainedObjects(reason)
}
}

private fun checkRetainedObjects(reason: String) {
...
//拿到遗留的泄漏对象个数
var retainedReferenceCount = objectWatcher.retainedObjectCount

if (retainedReferenceCount > 0) {
gcTrigger.runGc()
retainedReferenceCount = objectWatcher.retainedObjectCount
}
//app可见的时候,泄漏的对象超过(默认)5个时,继续进一步操作。(避免每泄漏一个对象都dump等等,影响开发者)
if (checkRetainedCount(retainedReferenceCount, config.retainedVisibleThreshold)) return

if (!config.dumpHeapWhenDebugging && DebuggerControl.isDebuggerAttached) {
showRetainedCountWithDebuggerAttached(retainedReferenceCount)
scheduleRetainedObjectCheck("debugger was attached", WAIT_FOR_DEBUG_MILLIS)
SharkLog.d {
"Not checking for leaks while the debugger is attached, will retry in $WAIT_FOR_DEBUG_MILLIS ms"
}
return
}

SharkLog.d { "Found $retainedReferenceCount retained references, dumping the heap" }
//记录dump的时间,减去检测到对象遗留的时间,就是对象泄漏的时间
val heapDumpUptimeMillis = SystemClock.uptimeMillis()
KeyedWeakReference.heapDumpUptimeMillis = heapDumpUptimeMillis
dismissRetainedCountNotification()
//dump文件,这里做了2件事。1.新建以当前时间为名称的文件夹。2.用Debug.dumpHprofData(heapDumpFile.absolutePath)来dump hprof文件数据到这个文件中
val heapDumpFile = heapDumper.dumpHeap()
if (heapDumpFile == null) {
SharkLog.d { "Failed to dump heap, will retry in $WAIT_AFTER_DUMP_FAILED_MILLIS ms" }
scheduleRetainedObjectCheck("failed to dump heap", WAIT_AFTER_DUMP_FAILED_MILLIS)
showRetainedCountWithHeapDumpFailed(retainedReferenceCount)
return
}
lastDisplayedRetainedObjectCount = 0
objectWatcher.clearObjectsWatchedBefore(heapDumpUptimeMillis)
//运行进程来分析dump文件
HeapAnalyzerService.runAnalysis(application, heapDumpFile)
}

启动service之后

1
2
3
4
5
6
7
8
9
10
11
12
13
14
15
16
17
18
19
override fun onHandleIntentInForeground(intent: Intent?) {
//设置线程优先级为后台线程,避免影响主线程
Process.setThreadPriority(Process.THREAD_PRIORITY_BACKGROUND)
val heapDumpFile = intent.getSerializableExtra(HEAPDUMP_FILE_EXTRA) as File

val heapAnalyzer = HeapAnalyzer(this)
val config = LeakCanary.config

//真正的分析过程
val heapAnalysis =
heapAnalyzer.analyze(
heapDumpFile, config.referenceMatchers, config.computeRetainedHeapSize, config.objectInspectors,
if (config.useExperimentalLeakFinders) config.objectInspectors else listOf(
ObjectInspectors.KEYED_WEAK_REFERENCE
)
)
//分析结果的回调
config.onHeapAnalyzedListener.onHeapAnalyzed(heapAnalysis)
}
1
2
3
4
5
6
7
8
9
10
11
12
13
14
15
16
17
18
19
20
21
22
23
24
25
26
27
28
29
30
31
32
33
34
35
36
37
38
39
40
41
42
43
44
45
46
47
48
49
50
51
class HeapAnalyzer{
//搜索heapDumpFile文件中的泄漏实例,然后计算从这些实例到GC Roots的最短强引用路径
fun analyze(
heapDumpFile: File,
referenceMatchers: List<ReferenceMatcher> = emptyList(),
computeRetainedHeapSize: Boolean = false,
objectInspectors: List<ObjectInspector> = emptyList(),
leakFinders: List<ObjectInspector> = objectInspectors,
proguardMapping: ProguardMapping? = null
): HeapAnalysis {
val analysisStartNanoTime = System.nanoTime()

if (!heapDumpFile.exists()) {
val exception = IllegalArgumentException("File does not exist: $heapDumpFile")
//文件不存在,则直接到REPORTING_HEAP_ANALYSIS阶段
listener.onAnalysisProgress(REPORTING_HEAP_ANALYSIS)
return HeapAnalysisFailure(
heapDumpFile, System.currentTimeMillis(), since(analysisStartNanoTime),
HeapAnalysisException(exception)
)
}

try {
//解析heap dump文件阶段(第1个阶段)
listener.onAnalysisProgress(PARSING_HEAP_DUMP)
Hprof.open(heapDumpFile)
.use { hprof ->
//1.将dump文件中的数据根据一定的解析规则读取出来,按照索引信息封装到HeapGraph对象中
val graph = HprofHeapGraph.indexHprof(hprof, proguardMapping)
//拿到泄漏的对象
val findLeakInput = FindLeakInput(
graph, leakFinders, referenceMatchers, computeRetainedHeapSize, objectInspectors
)
//查找到的泄漏原因分为应用泄漏和库泄漏
val (applicationLeaks, libraryLeaks) = findLeakInput.findLeaks()
//解析完毕,得到结果
listener.onAnalysisProgress(REPORTING_HEAP_ANALYSIS)
return HeapAnalysisSuccess(
heapDumpFile, System.currentTimeMillis(), since(analysisStartNanoTime),
applicationLeaks, libraryLeaks
)
}
} catch (exception: Throwable) {
listener.onAnalysisProgress(REPORTING_HEAP_ANALYSIS)
return HeapAnalysisFailure(
heapDumpFile, System.currentTimeMillis(), since(analysisStartNanoTime),
HeapAnalysisException(exception)
)
}
}
}
1
2
3
4
5
6
7
8
9
10
11
12
13
14
15
16
17
18
19
20
21
22
23
24
25
26
27
private fun FindLeakInput.findLeaks(): Pair<List<ApplicationLeak>, List<LibraryLeak>> {
val leakingInstanceObjectIds = findLeakingObjects()

val pathFinder = PathFinder(graph, listener, referenceMatchers)
val pathFindingResults =
//查找泄漏引用到gc root的最短路径。包含第4个阶段(FINDING_DOMINATORS)
pathFinder.findPathsFromGcRoots(leakingInstanceObjectIds, computeRetainedHeapSize)
//构建泄漏追踪
return buildLeakTraces(pathFindingResults)
}

private fun FindLeakInput.findLeakingObjects(): Set<Long> {
//第2个阶段:FINDING_LEAKING_INSTANCES查找泄漏对象
listener.onAnalysisProgress(FINDING_LEAKING_INSTANCES)
return graph.objects
.filter { objectRecord ->
val reporter = ObjectReporter(objectRecord)
leakFinders.any { inspector ->
//监听堆中找到的类,实例,数组等等。其具体实现分别是(shark-android#AndroidObjectInspectors和shark#ObjectInspectors)
//具体可以看一下AndroidObjectInspectors中监听的view,editor,匿名内部类这些对象
inspector.inspect(reporter)
reporter.leakingReasons.isNotEmpty()
}
}
.map { it.objectId }
.toSet()
}

第3个阶段:FINDING_PATHS_TO_LEAKING_OBJECTS

1
2
3
4
5
6
7
8
9
10
11
12
fun findPathsFromGcRoots(
leakingObjectIds: Set<Long>,
computeRetainedHeapSize: Boolean
): PathFindingResults {
listener.onAnalysisProgress(FINDING_PATHS_TO_LEAKING_OBJECTS)

val sizeOfObjectInstances = determineSizeOfObjectInstances(graph)

val state = State(leakingObjectIds, sizeOfObjectInstances, computeRetainedHeapSize)
//查找gc roots到实例的路径
return state.findPathsFromGcRoots()
}
1
2
3
4
5
6
7
8
9
10
11
12
13
14
15
16
17
18
19
20
21
22
23
24
25
26
27
28
29
30
31
32
33
34
35
36
37
38
39
40
41
private fun FindLeakInput.buildLeakTraces(pathFindingResults: PathFindingResults): Pair<List<ApplicationLeak>, List<LibraryLeak>> {
//包含2个阶段:COMPUTING_NATIVE_RETAINED_SIZE,和COMPUTING_RETAINED_SIZE,
val retainedSizes = computeRetainedSizes(pathFindingResults)

listener.onAnalysisProgress(BUILDING_LEAK_TRACES)

val applicationLeaks = mutableListOf<ApplicationLeak>()
val libraryLeaks = mutableListOf<LibraryLeak>()

val deduplicatedPaths = deduplicateShortestPaths(pathFindingResults.pathsToLeakingObjects)

deduplicatedPaths.forEachIndexed { index, pathNode ->
val shortestChildPath = mutableListOf<ChildNode>()

var node: ReferencePathNode = pathNode
while (node is ChildNode) {
shortestChildPath.add(0, node)
node = node.parent
}
val rootNode = node as RootNode

val leakTrace =
buildLeakTrace(graph, objectInspectors, rootNode, shortestChildPath)

val className =
recordClassName(graph.findObjectById(pathNode.objectId))

val firstLibraryLeakNode = if (rootNode is LibraryLeakNode) rootNode else
shortestChildPath.firstOrNull { it is LibraryLeakNode } as LibraryLeakNode?

if (firstLibraryLeakNode != null) {
val matcher = firstLibraryLeakNode.matcher
libraryLeaks += LibraryLeak(
className, leakTrace, retainedSizes?.get(index), matcher.pattern, matcher.description
)
} else {
applicationLeaks += ApplicationLeak(className, leakTrace, retainedSizes?.get(index))
}
}
return applicationLeaks to libraryLeaks
}
  • 泄漏引用通过字典树查找
  • hprof文件在Android中的解析对象

LeakCanary

  • Dump堆并且进行分析

  • 依赖于ObjectWatcher Android

组件id:com.squareup.leakcanary:leakcanary-android

LeakCanary Android separate process

默认进行内存泄漏检测的进程是在应用所在的进程。

这个liabrary顾名思义,让LeakCanary运行于独立app主进程之外的其他进程

组件id:com.squareup.leakcanary:leakcanary-android-process(替换com.squareup.leakcanary:leakcanary-android)

使用

一般情况下,我们只要在gradle中配置debugImplementaion就可以自动检测了。当然我们也可以手动检测有生命周期的其他对象,比如fragment,service,Dagger 组件,等等。这里用到AppWatcher.objectWatcher来观察应该被垃圾回收的实例:

1
2
3
4
5
6
7
8
9
class MyService : Service {

// ...

override fun onDestroy() {
super.onDestroy()
AppWatcher.objectWatcher.watch(this)
}
}

参考

文章LeakCanary: Detect all memory leaks!

[官方文档